5.9 KiB
description: Alethio EthStats Lite Network Monitor
Alethio EthStats Lite Network Monitor
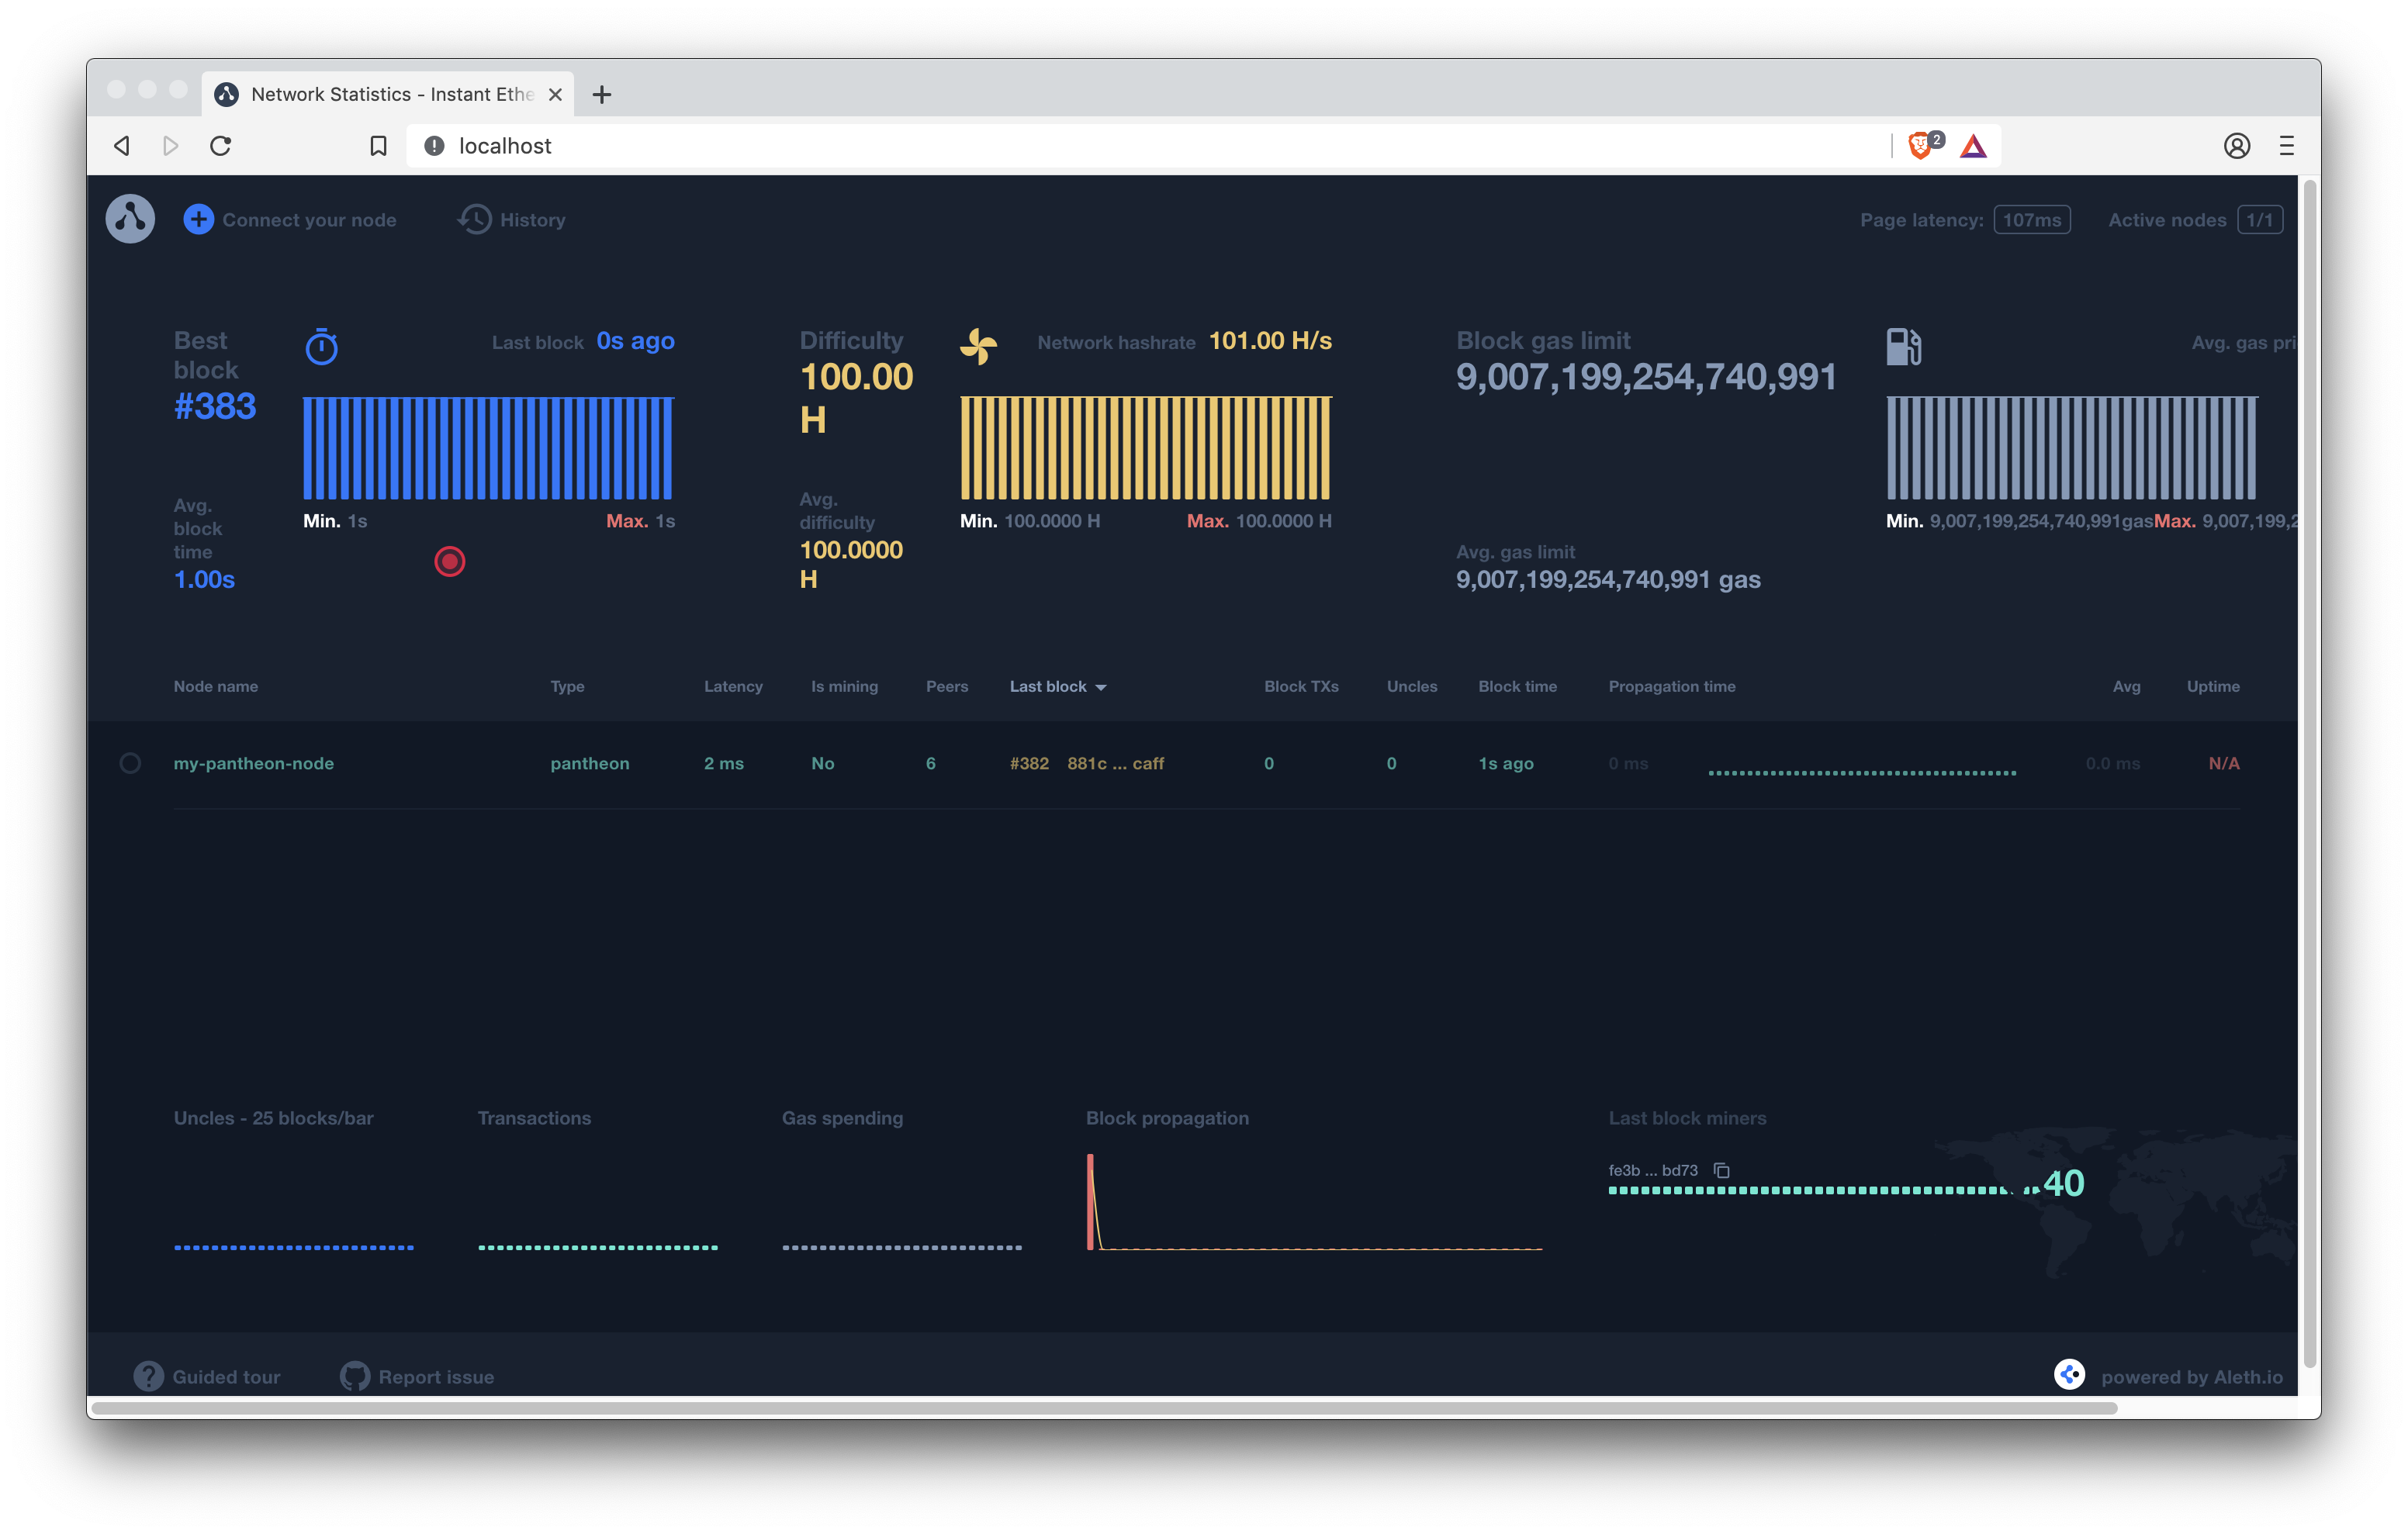
Use the Alethio EthStats Lite Network Monitor to have a live view of private network health by displaying real time and historical statistics about the network and nodes.
The lite version supports in-memory persistence or using Redis to persist a fixed number of blocks (by default, 3000).
You can also use a full online version of EthStats Network Monitor for the Ethereum MainNet.
!!! note The Alethio EthStats Lite Network Monitor is an Alethio product.
!!! tip Static local ports 80 and 3000 are used in the example running the Lite Network Monitor for a Pantheon Node.
Statistics
Statistics displayed by the Network Monitor include:
- Nodes in the network. Metrics for nodes include:
- Information about the last received block such as block number, block hash, transaction count, uncle count, block time and propagation time
- Connected peers, whether the node is mining, hash rate, latency, and uptime
- Charts for Block Time, Block Difficulty, Block Gas Limit, Block Uncles, Block Transactions, Block Gas Used, Block Propagation Histogram, and Top Miners
- IP based geolocation overview
- Node logs. Node logs display the data sent by a node
- Block history. Block history provides the ability to go back in time and playback the block propagation through the nodes
Components
The Network Monitor consists of:
-
Server. Consumes node data received from the client.
-
Client. A client must be started for each node in the network. The client extracts data from the node and sends it to the server
-
Dashboard. Dashboard displaying statistics.
Pre-requisities
!!! tip The Network Monitor has a number of dependencies. Using Docker is the easiest way to use the Network Monitor with Pantheon.
The [EthStats CLI](https://github.com/Alethio/ethstats-cli),
[EthStats Network Server](https://github.com/Alethio/ethstats-network-server), and [EthStats Network
Dashboard](https://github.com/Alethio/ethstats-network-dashboard) documentation describes how to
install the Network Monitor tools.
Running Lite Network Monitor for a Pantheon Node
!!! important This example describes how to run the Lite Network Monitor for a single Pantheon node. To run the Lite Network Monitor for a network of nodes, a client must be started for each node.
1. Server
Start the server using in-memory persistence:
-
Clone the server repository:
git clone https://github.com/Alethio/ethstats-network-server.git -
Change into the
/ethstats-network-server/docker/lite-mode/memory-persistencedirectory:cd ethstats-network-server/docker/lite-mode/memory-persistence -
Update the
docker-compose.ymlfile to your Pantheon network ID:- NETWORK_ID=2018 - NETWORK_NAME=mynetworkIn this example we are using the
devPantheon network with a network ID of2018. -
Start the server using Docker compose:
docker-compose up -d
!!! tip
A docker-compose file is provided in the ethstats-network-server/docker/lite-mode/redis-persistence
directory to run the server using Redis to persist a fixed number of blocks (default is 3000).
2. Pantheon
Start Pantheon in development mode with Websockets enabled:
docker run --rm -p 8546:8546 pegasyseng/pantheon:latest --miner-enabled --miner-coinbase fe3b557e8fb62b89f4916b721be55ceb828dbd73 --rpc-http-cors-origins="all" --rpc-ws-enabled --network=dev
Where <pantheondata-path> is the volume to which the node data is saved.
3. Client
Start the client for the Pantheon node:
docker run -d --rm --name ethstats-client --net host alethio/ethstats-cli --register --account-email <email> --node-name <node_name> --server-url http://localhost:3000 --client-url ws://127.0.0.1:8546
Where:
--server-urlspecifies your server. The default is the server that consumes data for the Ethereum MainNet.--registerspecifies the registration of the Pantheon node is done automatically with the specified<email>and<node_name>. Registering the node is only required the first time the client is started for the node.--client-urlspecifies the WebSockets URL for the Pantheon node.
4. Dashboard
To display the Network Monitor dashboard, open http://localhost in your browser.
!!! note "Default HTTP port" We are using the default HTTP port (80) to run the Lite Network Monitor. The Lite Block Explorer example uses port 8080. You can then run both at the same time.
To change the port, update the `docker-compose.yml` file:
```yaml
    ports:
      - 127.0.0.1:80:80
```

Update the first 80 to the required port:
```yaml
    ports:
      - 127.0.0.1:8081:80
```
Stopping and Cleaning Up Resources
When you've finished running the Network Monitor:
-
Stop Pantheon using ++ctrl+c++.
-
Stop the server and remove containers and volumes:
docker-compose down -v -
Stop the client:
docker stop ethstats-client!!! tip The client container is automatically removed because we used the
--rmoption.
